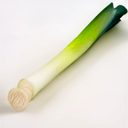
Leek
BLS 4.0 food: Leek raw (Porree/Lauch, roh), code G470100 · cross-reference USDA FDC #169246
Per portion (100 g)
Verified benefits — authorised EU health claims
Leek meets the legal condition for these claims (Regulation (EC) No 1924/2006 and (EU) No 432/2012). The numbers show exactly why.
Protein contributes to a growth in muscle mass.
Protein contributes to the maintenance of muscle mass.
Protein contributes to the maintenance of normal bones.
Vitamin C contributes to normal collagen formation for the normal function of blood vessels.
Vitamin C contributes to normal collagen formation for the normal function of bones.
Vitamin C contributes to normal collagen formation for the normal function of cartilage.
Show 16 more authorised claims
Vitamin C contributes to normal collagen formation for the normal function of gums.
Vitamin C contributes to normal collagen formation for the normal function of skin.
Vitamin C contributes to normal energy-yielding metabolism.
Vitamin C contributes to normal psychological function.
Vitamin C contributes to the normal function of the immune system.
Vitamin C contributes to the protection of cells from oxidative stress.
Vitamin C contributes to the reduction of tiredness and fatigue.
Vitamin C increases iron absorption.
Vitamin K contributes to normal blood clotting.
Vitamin K contributes to the maintenance of normal bones.
Folate contributes to maternal tissue growth during pregnancy.
Folate contributes to normal blood formation.
Folate contributes to normal psychological function.
Folate contributes to the normal function of the immune system.
Folate contributes to the reduction of tiredness and fatigue.
Folate has a role in the process of cell division.
Also low in sodium and saturated fat — which relates to the authorised claims: “Reducing consumption of sodium contributes to the maintenance of normal blood pressure.” “Reducing consumption of saturated fat contributes to the maintenance of normal blood cholesterol levels.”
Goals this food supports
Full nutrient profile
Values per 100 g edible portion as published by the Max Rubner-Institut (BLS 4.0, 10.25826/Data20251217-134202-0). "Origin" is the MRI's own data-provenance label; open "reference" for the underlying study or database. %NRV = share of the EU Nutrient Reference Value (Reg. (EU) 1169/2011, Annex XIII).
Energy & macronutrients
| Nutrient | per 100 g | per 100 g | %NRV | Origin |
|---|---|---|---|---|
| Energy | 36 kcal | 36 kcal | BLS ENERCC · Calculated by formula | |
| Protein | 2.1 g | 2.1 g | BLS PROT625 · Other nutrient databasereferenceConverted value from: Kirchhoff, E; Souci - Fachmann - Kraut - Die Zusammensetzung der Lebensmittel - Nährwert-Tabellen; 2008; 7 | |
| Fat | 0.25 g | 0.25 g | BLS FAT · Scientific literaturereferenceTsiaganis MC, Laskari K, Melissari E; Fatty acid composition of Allium species lipids; Journal of Food Composition and Analysis; 2006 | |
| Carbohydrate (available) | 5 g | 5 g | BLS CHO · Calculated by formula | |
| Sugars (total) | 3.8 g | 3.8 g | BLS SUGAR · Calculated by formula | |
| starch | 1 g | 1 g | BLS STARCH · Scientific literaturereferenceConverted value from: Public Health England, Nutrient analysis of fruits and vegetables. 2017 | |
| Dietary fibre | 2.2 g | 2.2 g | BLS FIBT · Laboratory analysis | |
| fibreSoluble | 0.5 g | 0.5 g | BLS FIBSOL · Laboratory analysis | |
| Water | 90.4 g | 90.4 g | BLS WATER · Aggregated from several sourcesreferenceStalikas, C. D., et al.; Multielement concentrations in vegetable species grown in two typical agricultural areas of Greece.; Science of the Total Environment; 1997; 206; 1 Priecina, L. and D. Karklina; Determination of major sugars in fresh and dried spices and vegetables using high performance liquid chromatography.; FOODBALT; 2014 Public Health England, Nutrient analysis of fruits and vegetables. 2017 Shohag, M. J. I., et al.; Folate Content and Composition of Vegetables Commonly Consumed in China.; Journal of Food Science; 2012; 77; 11 | |
| Salt | 0.0 g | 0.0 g | BLS NACL · Calculated by formula |
Fats & fatty acids
| Nutrient | per 100 g | per 100 g | %NRV | Origin |
|---|---|---|---|---|
| Saturated fat | 0.04 g | 0.04 g | BLS FASAT · Calculated by formula | |
| Monounsaturated fat | 0.01 g | 0.01 g | BLS FAMS · Calculated by formula | |
| Polyunsaturated fat | 0.1 g | 0.1 g | BLS FAPU · Calculated by formula | |
| Omega-3 fatty acids (total) | 0.01 g | 0.01 g | BLS FAPUN3 · Calculated by formula | |
| Alpha-linolenic acid (ALA, omega-3) | 0.01 g | 0.01 g | BLS F18:3CN3 · Scientific literaturereferenceConverted value from: Tsiaganis MC, Laskari K, Melissari E; Fatty acid composition of Allium species lipids; Journal of Food Composition and Analysis; 2006 | |
| EPA | 0 mg | 0 mg | BLS F20:5CN3 · Logische Null | |
| DHA | 0 mg | 0 mg | BLS F22:6CN3 · Logische Null | |
| EPA + DHA (long-chain omega-3) | 0 mg | 0 mg | BLS | |
| omega6 | 0.09 g | 0.09 g | BLS FAPUN6 · Calculated by formula | |
| Linoleic acid (omega-6) | 0.09 g | 0.09 g | BLS F18:2CN6 · Scientific literaturereferenceConverted value from: Tsiaganis MC, Laskari K, Melissari E; Fatty acid composition of Allium species lipids; Journal of Food Composition and Analysis; 2006 | |
| Oleic acid | 0.01 g | 0.01 g | BLS F18:1CN9 · Scientific literaturereferenceConverted value from: Tsiaganis MC, Laskari K, Melissari E; Fatty acid composition of Allium species lipids; Journal of Food Composition and Analysis; 2006 | |
| Cholesterol | 0 mg | 0 mg | BLS CHORL · Logische Null |
Vitamins
| Nutrient | per 100 g | per 100 g | %NRV | Origin |
|---|---|---|---|---|
| Vitamin A | 45 µg | 45 µg | 6 % | BLS VITAA · Calculated by formula |
| Vitamin D | 0 µg | 0 µg | 0 % | BLS VITD · Calculated by formula |
| Vitamin E | 0.35 mg | 0.35 mg | 3 % | BLS VITE · Scientific literaturereferenceConverted value from: Public Health England, Nutrient analysis of fruits and vegetables. 2017 |
| Vitamin K | 54 µg | 54 µg | 72 % | BLS VITK · Calculated by formula |
| Vitamin C | 24 mg | 24 mg | 30 % | BLS VITC · Other nutrient databasereferenceKirchhoff, E; Souci - Fachmann - Kraut - Die Zusammensetzung der Lebensmittel - Nährwert-Tabellen; 2008; 7 |
| Thiamin (vitamin B1) | 0.05 mg | 0.05 mg | 5 % | BLS THIA · Scientific literaturereferenceConverted value from: Public Health England, Nutrient analysis of fruits and vegetables. 2017 |
| Riboflavin (vitamin B2) | 0.03 mg | 0.03 mg | 2 % | BLS RIBF · Scientific literaturereferencePublic Health England, Nutrient analysis of fruits and vegetables. 2017 |
| Niacin (vitamin B3) | 0.7 mg | 0.7 mg | 4 % | BLS NIAEQ · Calculated by formula |
| Pantothenic acid (vitamin B5) | 0.15 mg | 0.15 mg | 3 % | BLS PANTAC · Scientific literaturereferencePublic Health England, Nutrient analysis of fruits and vegetables. 2017 |
| Vitamin B6 | 0.14 mg | 0.14 mg | 10 % | BLS VITB6 · Scientific literaturereferenceConverted value from: Public Health England, Nutrient analysis of fruits and vegetables. 2017 |
| Biotin | 3 µg | 3 µg | 6 % | BLS BIOT · Scientific literaturereferencePublic Health England, Nutrient analysis of fruits and vegetables. 2017 |
| Folate | 64 µg | 64 µg | 32 % | BLS FOL · Calculated by formula |
| Vitamin B12 | 0 µg | 0 µg | 0 % | BLS VITB12 · Logische Null |
| Choline | 9.5 mg | 9.5 mg | USDA FDC 169246 |
Minerals & trace elements
| Nutrient | per 100 g | per 100 g | %NRV | Origin |
|---|---|---|---|---|
| Potassium | 275 mg | 275 mg | 14 % | BLS K · Aggregated from several sourcesreferenceKoivistoinen P; Mineral element composition of Finnish foods. N, K, Ca, Mg, P, S, Fe, Cu, Mn, Zn, Mo, Co, Ni, Cr, F, Se, Si, Rb, Al, B, Br, Hg, As, Cd, Pb and Ash; Almqvist & Wiksell; 1980 Public Health England, Nutrient analysis of fruits and vegetables. 2017 |
| Calcium | 42 mg | 42 mg | 5 % | BLS CA · Aggregated from several sourcesreferencePublic Health England, Nutrient analysis of fruits and vegetables. 2017 Koivistoinen P; Mineral element composition of Finnish foods. N, K, Ca, Mg, P, S, Fe, Cu, Mn, Zn, Mo, Co, Ni, Cr, F, Se, Si, Rb, Al, B, Br, Hg, As, Cd, Pb and Ash; Almqvist & Wiksell; 1980 |
| Magnesium | 7 mg | 7 mg | 2 % | BLS MG · Scientific literaturereferencePublic Health England, Nutrient analysis of fruits and vegetables. 2017 |
| Phosphorus | 23 mg | 23 mg | 3 % | BLS P · Scientific literaturereferencePublic Health England, Nutrient analysis of fruits and vegetables. 2017 |
| Iron | 0.4 mg | 0.4 mg | 3 % | BLS FE · Aggregated from several sourcesreferenceKoivistoinen P; Mineral element composition of Finnish foods. N, K, Ca, Mg, P, S, Fe, Cu, Mn, Zn, Mo, Co, Ni, Cr, F, Se, Si, Rb, Al, B, Br, Hg, As, Cd, Pb and Ash; Almqvist & Wiksell; 1980 Public Health England, Nutrient analysis of fruits and vegetables. 2017 Converted value from: BVL; Lebensmittel Monitoring 2016; 2016 |
| Zinc | 0.2 mg | 0.2 mg | 2 % | BLS ZN · Aggregated from several sourcesreferenceKoivistoinen P; Mineral element composition of Finnish foods. N, K, Ca, Mg, P, S, Fe, Cu, Mn, Zn, Mo, Co, Ni, Cr, F, Se, Si, Rb, Al, B, Br, Hg, As, Cd, Pb and Ash; Almqvist & Wiksell; 1980 Converted value from: BVL; Lebensmittel Monitoring 2010; 2010 Converted value from: BVL; Lebensmittel Monitoring 2004; 2004 Converted value from: BVL; Lebensmittel Monitoring 2013; 2013 Public Health England, Nutrient analysis of fruits and vegetables. 2017 |
| Iodine | 1 µg | 1 µg | 1 % | BLS ID · Aggregated from several sourcesreferencePublic Health England; McCance and Widdowson& 39;s The Composition of Foods Integrated Dataset; 2021 National Food Institute, Food data (frida.fooddata.dk), version 5.2, May 2024 |
| Selenium | 1 µg | 1 µg | 2 % | USDA FDC 169246 |
| Copper | 0.04 mg | 0.04 mg | 4 % | BLS CU · Aggregated from several sourcesreferenceConverted value from: BVL; Lebensmittel Monitoring 2010; 2010 Converted value from: BVL; Lebensmittel Monitoring 2004; 2004 Converted value from: BVL; Lebensmittel Monitoring 2013; 2013 Public Health England, Nutrient analysis of fruits and vegetables. 2017 Koivistoinen P; Mineral element composition of Finnish foods. N, K, Ca, Mg, P, S, Fe, Cu, Mn, Zn, Mo, Co, Ni, Cr, F, Se, Si, Rb, Al, B, Br, Hg, As, Cd, Pb and Ash; Almqvist & Wiksell; 1980 |
| Manganese | 0.17 mg | 0.17 mg | 9 % | BLS MN · Aggregated from several sourcesreferenceKoivistoinen P; Mineral element composition of Finnish foods. N, K, Ca, Mg, P, S, Fe, Cu, Mn, Zn, Mo, Co, Ni, Cr, F, Se, Si, Rb, Al, B, Br, Hg, As, Cd, Pb and Ash; Almqvist & Wiksell; 1980 Converted value from: BVL; Lebensmittel Monitoring 2016; 2016 Converted value from: BVL; Lebensmittel Monitoring 2013; 2013 |
| fluoride | 0.01 mg | 0.01 mg | BLS FD · Other nutrient databasereferenceKirchhoff, E; Souci - Fachmann - Kraut - Die Zusammensetzung der Lebensmittel - Nährwert-Tabellen; 2008; 7 |
Essential amino acids
| Nutrient | per 100 g | per 100 g | %NRV | Origin |
|---|---|---|---|---|
| Histidine | 0.04 g | 0.04 g | BLS HIS · Other nutrient databasereferenceKirchhoff, E; Souci - Fachmann - Kraut - Die Zusammensetzung der Lebensmittel - Nährwert-Tabellen; 2008; 7 | |
| Isoleucine | 0.08 g | 0.08 g | BLS ILE · Other nutrient databasereferenceKirchhoff, E; Souci - Fachmann - Kraut - Die Zusammensetzung der Lebensmittel - Nährwert-Tabellen; 2008; 7 | |
| Leucine | 0.13 g | 0.13 g | BLS LEU · Other nutrient databasereferenceKirchhoff, E; Souci - Fachmann - Kraut - Die Zusammensetzung der Lebensmittel - Nährwert-Tabellen; 2008; 7 | |
| Lysine | 0.14 g | 0.14 g | BLS LYS · Other nutrient databasereferenceKirchhoff, E; Souci - Fachmann - Kraut - Die Zusammensetzung der Lebensmittel - Nährwert-Tabellen; 2008; 7 | |
| Methionine | 0.03 g | 0.03 g | BLS MET · Other nutrient databasereferenceKirchhoff, E; Souci - Fachmann - Kraut - Die Zusammensetzung der Lebensmittel - Nährwert-Tabellen; 2008; 7 | |
| Phenylalanine | 0.06 g | 0.06 g | BLS PHE · Other nutrient databasereferenceKirchhoff, E; Souci - Fachmann - Kraut - Die Zusammensetzung der Lebensmittel - Nährwert-Tabellen; 2008; 7 | |
| Threonine | 0.08 g | 0.08 g | BLS THR · Other nutrient databasereferenceKirchhoff, E; Souci - Fachmann - Kraut - Die Zusammensetzung der Lebensmittel - Nährwert-Tabellen; 2008; 7 | |
| Tryptophan | 0.02 g | 0.02 g | BLS TRP · Other nutrient databasereferenceKirchhoff, E; Souci - Fachmann - Kraut - Die Zusammensetzung der Lebensmittel - Nährwert-Tabellen; 2008; 7 | |
| Valine | 0.09 g | 0.09 g | BLS VAL · Other nutrient databasereferenceKirchhoff, E; Souci - Fachmann - Kraut - Die Zusammensetzung der Lebensmittel - Nährwert-Tabellen; 2008; 7 |
Sources
- Bundeslebensmittelschlüssel (BLS) 4.0 — German Nutrient Database — Max Rubner-Institut
- FoodData Central — USDA Agricultural Research Service
- Commission Regulation (EU) No 432/2012 — list of permitted health claims (consolidated) — European Union (EUR-Lex)
- Regulation (EC) No 1924/2006 on nutrition and health claims (incl. Annex: conditions for "source of" claims) — European Union (EUR-Lex)
- Regulation (EU) No 1169/2011 on food information (Annex XIII: Nutrient Reference Values; Art. 7(3)) — European Union (EUR-Lex)
- EU Register of nutrition and health claims made on foods — European Commission
- Vitamin C — fact sheet for health professionals — NIH Office of Dietary Supplements
- Vitamin K — fact sheet for health professionals — NIH Office of Dietary Supplements
- Folate — fact sheet for health professionals — NIH Office of Dietary Supplements
Max Rubner-Institut (2025): Bundeslebensmittelschlüssel (BLS), Version 4.0 — Deutsche Nährstoffdatenbank. Karlsruhe. DOI: 10.25826/Data20251217-134202-0. Licence CC BY 4.0. Selenium and choline: U.S. Department of Agriculture, Agricultural Research Service. FoodData Central: SR Legacy, 2018. fdc.nal.usda.gov.