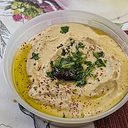
Hummus
BLS 4.0 food: Hummus/chickpea puree (Hummus/Kichererbsenmus), code H960000 · cross-reference USDA FDC #174289
Per portion (50 g)
162 kcalenergy
3 gprotein
3 gfibre
14.3 gfat
4 gcarbohydrate
Verified benefits — authorised EU health claims
Hummus meets the legal condition for these claims (Regulation (EC) No 1924/2006 and (EU) No 432/2012). The numbers show exactly why.
Linoleic acid contributes to the maintenance of normal blood cholesterol levels.
✓ 9.4 g linoleic acid per 100 g; condition: at least 1.5 g per 100 g and per 100 kcal. Beneficial effect obtained with 10 g of linoleic acid per day.
EUR-LexEU CommissionReplacing saturated fats in the diet with unsaturated fats contributes to the maintenance of normal blood cholesterol levels.
✓ 87 % of fatty acids are unsaturated and they provide 65 % of energy; condition for "high unsaturated fat": at least 70 % and more than 20 %.
EUR-LexEU CommissionVitamin E contributes to the protection of cells from oxidative stress.
✓ 8.3 mg per 100 g = 69 % of the EU NRV (12 mg); condition: at least 15 %.
EUR-LexEU CommissionNIH ODSVitamin K contributes to normal blood clotting.
✓ 34 µg per 100 g = 45 % of the EU NRV (75 µg); condition: at least 15 %.
EUR-LexEU CommissionNIH ODSVitamin K contributes to the maintenance of normal bones.
✓ 34 µg per 100 g = 45 % of the EU NRV (75 µg); condition: at least 15 %.
EUR-LexEU CommissionNIH ODSThiamine contributes to normal energy-yielding metabolism.
✓ 0.24 mg per 100 g = 22 % of the EU NRV (1.1 mg); condition: at least 15 %.
EUR-LexEU CommissionNIH ODSShow 14 more authorised claims
Thiamine contributes to normal psychological function.
✓ 0.24 mg per 100 g = 22 % of the EU NRV (1.1 mg); condition: at least 15 %.
EUR-LexEU CommissionNIH ODSThiamine contributes to the normal function of the heart.
✓ 0.24 mg per 100 g = 22 % of the EU NRV (1.1 mg); condition: at least 15 %.
EUR-LexEU CommissionNIH ODSMagnesium contributes to a reduction of tiredness and fatigue.
✓ 65 mg per 100 g = 17 % of the EU NRV (375 mg); condition: at least 15 %.
EUR-LexEU CommissionNIH ODSMagnesium contributes to normal muscle function.
✓ 65 mg per 100 g = 17 % of the EU NRV (375 mg); condition: at least 15 %.
EUR-LexEU CommissionNIH ODSMagnesium contributes to normal psychological function.
✓ 65 mg per 100 g = 17 % of the EU NRV (375 mg); condition: at least 15 %.
EUR-LexEU CommissionNIH ODSMagnesium contributes to normal protein synthesis.
✓ 65 mg per 100 g = 17 % of the EU NRV (375 mg); condition: at least 15 %.
EUR-LexEU CommissionNIH ODSMagnesium contributes to the maintenance of normal bones.
✓ 65 mg per 100 g = 17 % of the EU NRV (375 mg); condition: at least 15 %.
EUR-LexEU CommissionNIH ODSPhosphorus contributes to the maintenance of normal bones.
✓ 155 mg per 100 g = 22 % of the EU NRV (700 mg); condition: at least 15 %.
EUR-LexEU CommissionNIH ODSCopper contributes to maintenance of normal connective tissues.
✓ 0.32 mg per 100 g = 32 % of the EU NRV (1 mg); condition: at least 15 %.
EUR-LexEU CommissionNIH ODSCopper contributes to normal hair pigmentation.
✓ 0.32 mg per 100 g = 32 % of the EU NRV (1 mg); condition: at least 15 %.
EUR-LexEU CommissionNIH ODSCopper contributes to normal iron transport in the body.
✓ 0.32 mg per 100 g = 32 % of the EU NRV (1 mg); condition: at least 15 %.
EUR-LexEU CommissionNIH ODSCopper contributes to the normal function of the immune system.
✓ 0.32 mg per 100 g = 32 % of the EU NRV (1 mg); condition: at least 15 %.
EUR-LexEU CommissionNIH ODSManganese contributes to the maintenance of normal bones.
✓ 0.76 mg per 100 g = 38 % of the EU NRV (2 mg); condition: at least 15 %.
EUR-LexEU CommissionNIH ODSManganese contributes to the normal formation of connective tissue.
✓ 0.76 mg per 100 g = 38 % of the EU NRV (2 mg); condition: at least 15 %.
EUR-LexEU CommissionNIH ODSGoals this food supports
Full nutrient profile
Values per 100 g edible portion as published by the Max Rubner-Institut (BLS 4.0, 10.25826/Data20251217-134202-0). "Origin" is the MRI's own data-provenance label; open "reference" for the underlying study or database. %NRV = share of the EU Nutrient Reference Value (Reg. (EU) 1169/2011, Annex XIII).
Energy & macronutrients
| Nutrient | per 100 g | per 50 g | %NRV | Origin |
|---|
| Energy | 324 kcal | 162 kcal | | BLS ENERCC · Calculated by formula |
| Protein | 5.9 g | 3 g | | BLS PROT625 · Recipe calculation |
| Fat | 28.5 g | 14.3 g | | BLS FAT · Recipe calculation |
| Carbohydrate (available) | 8 g | 4 g | | BLS CHO · Calculated by formula |
| Sugars (total) | 0.7 g | 0.35 g | | BLS SUGAR · Calculated by formula |
| starch | 7 g | 3.5 g | | BLS STARCH · Recipe calculation |
| Dietary fibre | 5.9 g | 3 g | | BLS FIBT · Recipe calculation |
| Water | 50 g | 25 g | | BLS WATER · Recipe calculation |
| Salt | 0.98 g | 0.49 g | | BLS NACL · Calculated by formula |
Fats & fatty acids
Vitamins
Minerals & trace elements
| Nutrient | per 100 g | per 50 g | %NRV | Origin |
|---|
| Sodium | 392 mg | 196 mg | | BLS NA · Recipe calculation |
| Potassium | 190 mg | 95 mg | 10 % | BLS K · Recipe calculation |
| Calcium | 58 mg | 29 mg | 7 % | BLS CA · Recipe calculation |
| Magnesium | 65 mg | 32.5 mg | 17 % | BLS MG · Recipe calculation |
| Phosphorus | 155 mg | 77.5 mg | 22 % | BLS P · Recipe calculation |
| Iron | 1.7 mg | 0.85 mg | 12 % | BLS FE · Recipe calculation |
| Zinc | 1.2 mg | 0.6 mg | 12 % | BLS ZN · Recipe calculation |
| Iodine | 1 µg | 0.5 µg | 1 % | BLS ID · Recipe calculation |
| Selenium | 4.7 µg | 2.4 µg | 9 % | USDA FDC 174289 |
| Copper | 0.32 mg | 0.16 mg | 32 % | BLS CU · Recipe calculation |
| Manganese | 0.76 mg | 0.38 mg | 38 % | BLS MN · Recipe calculation |
| fluoride | 0 mg | 0 mg | | BLS FD · Recipe calculation |
Essential amino acids
| Nutrient | per 100 g | per 50 g | %NRV | Origin |
|---|
| Histidine | 0.2 g | 0.1 g | | BLS HIS · Recipe calculation |
| Isoleucine | 0.3 g | 0.15 g | | BLS ILE · Recipe calculation |
| Leucine | 0.4 g | 0.2 g | | BLS LEU · Recipe calculation |
| Lysine | 0.32 g | 0.16 g | | BLS LYS · Recipe calculation |
| Methionine | 0.12 g | 0.06 g | | BLS MET · Recipe calculation |
| Phenylalanine | 0.29 g | 0.15 g | | BLS PHE · Recipe calculation |
| Threonine | 0.22 g | 0.11 g | | BLS THR · Recipe calculation |
| Tryptophan | 0.08 g | 0.04 g | | BLS TRP · Recipe calculation |
| Valine | 0 g | 0 g | | BLS VAL · Recipe calculation |
Sources
Max Rubner-Institut (2025): Bundeslebensmittelschlüssel (BLS), Version 4.0 — Deutsche Nährstoffdatenbank. Karlsruhe. DOI: 10.25826/Data20251217-134202-0. Licence CC BY 4.0. Selenium and choline: U.S. Department of Agriculture, Agricultural Research Service. FoodData Central: SR Legacy, 2018. fdc.nal.usda.gov.
Build a plan that includes the right foods for you →