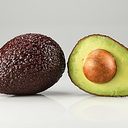
Avocado
BLS 4.0 food: Avocado raw (Avocado roh), code F502100 · cross-reference USDA FDC #171705
Per portion (75 g)
Verified benefits — authorised EU health claims
Avocado meets the legal condition for these claims (Regulation (EC) No 1924/2006 and (EU) No 432/2012). The numbers show exactly why.
Replacing saturated fats in the diet with unsaturated fats contributes to the maintenance of normal blood cholesterol levels.
Vitamin C contributes to normal collagen formation for the normal function of blood vessels.
Vitamin C contributes to normal collagen formation for the normal function of bones.
Vitamin C contributes to normal collagen formation for the normal function of cartilage.
Vitamin C contributes to normal collagen formation for the normal function of gums.
Vitamin C contributes to normal collagen formation for the normal function of skin.
Show 21 more authorised claims
Vitamin C contributes to normal energy-yielding metabolism.
Vitamin C contributes to normal psychological function.
Vitamin C contributes to the normal function of the immune system.
Vitamin C contributes to the protection of cells from oxidative stress.
Vitamin C contributes to the reduction of tiredness and fatigue.
Vitamin C increases iron absorption.
Vitamin K contributes to normal blood clotting.
Vitamin K contributes to the maintenance of normal bones.
Pantothenic acid contributes to normal mental performance.
Pantothenic acid contributes to the reduction of tiredness and fatigue.
Vitamin B6 contributes to normal psychological function.
Vitamin B6 contributes to normal red blood cell formation.
Vitamin B6 contributes to the normal function of the immune system.
Vitamin B6 contributes to the reduction of tiredness and fatigue.
Vitamin B6 contributes to the regulation of hormonal activity.
Potassium contributes to the maintenance of normal blood pressure.
Potassium contributes to normal muscle function.
Copper contributes to maintenance of normal connective tissues.
Copper contributes to normal hair pigmentation.
Copper contributes to normal iron transport in the body.
Copper contributes to the normal function of the immune system.
Also low in sodium — which relates to the authorised claims: “Reducing consumption of sodium contributes to the maintenance of normal blood pressure.”
Goals this food supports
Full nutrient profile
Values per 100 g edible portion as published by the Max Rubner-Institut (BLS 4.0, 10.25826/Data20251217-134202-0). "Origin" is the MRI's own data-provenance label; open "reference" for the underlying study or database. %NRV = share of the EU Nutrient Reference Value (Reg. (EU) 1169/2011, Annex XIII).
Energy & macronutrients
| Nutrient | per 100 g | per 75 g | %NRV | Origin |
|---|---|---|---|---|
| Energy | 132 kcal | 99 kcal | BLS ENERCC · Calculated by formula | |
| Protein | 1.4 g | 1 g | BLS PROT625 · Laboratory analysis | |
| Fat | 12.5 g | 9.4 g | BLS FAT · Laboratory analysis | |
| Carbohydrate (available) | 1.4 g | 1 g | BLS CHO · Calculated by formula | |
| Sugars (total) | 1.4 g | 1 g | BLS SUGAR · Calculated by formula | |
| Dietary fibre | 4.1 g | 3.1 g | BLS FIBT · Laboratory analysis | |
| Water | 77.2 g | 57.9 g | BLS WATER · Laboratory analysis | |
| Salt | 0.01 g | 0.01 g | BLS NACL · Calculated by formula |
Fats & fatty acids
| Nutrient | per 100 g | per 75 g | %NRV | Origin |
|---|---|---|---|---|
| Saturated fat | 2.6 g | 1.9 g | BLS FASAT · Calculated by formula | |
| Monounsaturated fat | 7.6 g | 5.7 g | BLS FAMS · Calculated by formula | |
| Polyunsaturated fat | 1.5 g | 1.1 g | BLS FAPU · Calculated by formula | |
| Omega-3 fatty acids (total) | 0.1 g | 0.08 g | BLS FAPUN3 · Calculated by formula | |
| Alpha-linolenic acid (ALA, omega-3) | 0.1 g | 0.08 g | BLS F18:3CN3 · Laboratory analysis | |
| omega6 | 1.4 g | 1.1 g | BLS FAPUN6 · Calculated by formula | |
| Linoleic acid (omega-6) | 1.4 g | 1.1 g | BLS F18:2CN6 · Laboratory analysis | |
| Oleic acid | 6.5 g | 4.9 g | BLS F18:1CN9 · Laboratory analysis |
Vitamins
| Nutrient | per 100 g | per 75 g | %NRV | Origin |
|---|---|---|---|---|
| Vitamin A | 10 µg | 7.5 µg | 1 % | BLS VITAA · Calculated by formula |
| Vitamin D | 0 µg | 0 µg | 0 % | BLS VITD · Calculated by formula |
| Vitamin E | 1.7 mg | 1.3 mg | 14 % | BLS VITE · Scientific literaturereferenceConverted value from: Public Health England, Nutrient analysis of fruits and vegetables. 2017 |
| Vitamin K | 14.1 µg | 10.6 µg | 19 % | BLS VITK · Calculated by formula |
| Vitamin C | 13 mg | 9.8 mg | 16 % | BLS VITC · Aggregated from several sourcesreferenceUS Department of Agriculture, Agricultural Research Service; USDA National Nutrient Database for Standard Reference, Legacy Release; 2019 Leibniz-Institut für Lebensmittel-Systembiologie; SFK Online Version; 2016 |
| Thiamin (vitamin B1) | 0.07 mg | 0.05 mg | 6 % | BLS THIA · Laboratory analysis |
| Riboflavin (vitamin B2) | 0.1 mg | 0.07 mg | 7 % | BLS RIBF · Laboratory analysis |
| Niacin (vitamin B3) | 1 mg | 0.76 mg | 6 % | BLS NIAEQ · Calculated by formula |
| Pantothenic acid (vitamin B5) | 1.3 mg | 1 mg | 22 % | BLS PANTAC · Scientific literaturereferencePublic Health England, Nutrient analysis of fruits and vegetables. 2017 |
| Vitamin B6 | 0.27 mg | 0.2 mg | 19 % | BLS VITB6 · Laboratory analysis |
| Biotin | 2.4 µg | 1.8 µg | 5 % | BLS BIOT · Scientific literaturereferencePublic Health England, Nutrient analysis of fruits and vegetables. 2017 |
| Folate | 20.2 µg | 15.2 µg | 10 % | BLS FOL · Calculated by formula |
| Choline | 14.2 mg | 10.7 mg | USDA FDC 171705 |
Minerals & trace elements
| Nutrient | per 100 g | per 75 g | %NRV | Origin |
|---|---|---|---|---|
| Sodium | 5 mg | 3.8 mg | BLS NA · Aggregated from several sourcesreferencePublic Health England, Nutrient analysis of fruits and vegetables. 2017 Morais, D. R., et al.; Proximate composition, mineral contents and fatty acid composition of the different parts and dried peels of tropical fruits cultivated in Brazil.; Journal of the Brazilian Chemical Society; 2017; 28; 2 Sanchez-Castillo, C. P., et al.; The Mineral Content of Mexican Fruits and Vegetables.; Journal of Food Composition and Analysis; 1998; 11; 4 Pennington, J. A. T., et al.; Composition of Core Foods of the U.S. Food Supply, 1982-1991: I. Sodium, Phosphorus, and Potassium.; Journal of Food Composition and Analysis; 1995 Miller-Ihli, NJ; Atomic absorption and atomic emission spectrometry for the determination of the trace element content of selected fruits consumed in the United States; Journal of Food Composition and Analysis; 1996; 9 Barea-Álvarez M, Delgado-Andrade C, Haro A, Olalla M, Seiquer I, Rufián-Henares JÁ; Subtropical fruits grown in Spain and elsewhere: A comparison of mineral profiles.; Journal of Food Composition and Analysis; 2016; 48 | |
| Potassium | 550 mg | 413 mg | 28 % | BLS K · Laboratory analysis |
| Calcium | 14 mg | 10.5 mg | 2 % | BLS CA · Laboratory analysis |
| Magnesium | 24.6 mg | 18.4 mg | 7 % | BLS MG · Laboratory analysis |
| Phosphorus | 48.8 mg | 36.6 mg | 7 % | BLS P · Laboratory analysis |
| Iron | 0.44 mg | 0.33 mg | 3 % | BLS FE · Laboratory analysis |
| Zinc | 0.64 mg | 0.48 mg | 6 % | BLS ZN · Laboratory analysis |
| Iodine | 3 µg | 2.3 µg | 2 % | BLS ID · Laboratory analysis |
| Selenium | 0.4 µg | 0.3 µg | 1 % | USDA FDC 171705 |
| Copper | 0.39 mg | 0.29 mg | 39 % | BLS CU · Laboratory analysis |
| Manganese | 0.19 mg | 0.14 mg | 9 % | BLS MN · Laboratory analysis |
| fluoride | 0.05 mg | 0.04 mg | BLS FD · Laboratory analysis |
Essential amino acids
| Nutrient | per 100 g | per 75 g | %NRV | Origin |
|---|---|---|---|---|
| Isoleucine | 0.05 g | 0.04 g | BLS ILE · Laboratory analysis | |
| Leucine | 0.09 g | 0.07 g | BLS LEU · Laboratory analysis | |
| Lysine | 0.09 g | 0.07 g | BLS LYS · Laboratory analysis | |
| Phenylalanine | 0.06 g | 0.04 g | BLS PHE · Laboratory analysis | |
| Threonine | 0.06 g | 0.04 g | BLS THR · Laboratory analysis | |
| Valine | 0.08 g | 0.06 g | BLS VAL · Laboratory analysis |
Sources
- Bundeslebensmittelschlüssel (BLS) 4.0 — German Nutrient Database — Max Rubner-Institut
- FoodData Central — USDA Agricultural Research Service
- Commission Regulation (EU) No 432/2012 — list of permitted health claims (consolidated) — European Union (EUR-Lex)
- Regulation (EC) No 1924/2006 on nutrition and health claims (incl. Annex: conditions for "source of" claims) — European Union (EUR-Lex)
- Regulation (EU) No 1169/2011 on food information (Annex XIII: Nutrient Reference Values; Art. 7(3)) — European Union (EUR-Lex)
- EU Register of nutrition and health claims made on foods — European Commission
- Vitamin C — fact sheet for health professionals — NIH Office of Dietary Supplements
- Vitamin K — fact sheet for health professionals — NIH Office of Dietary Supplements
- Pantothenic Acid — fact sheet for health professionals — NIH Office of Dietary Supplements
- Vitamin B6 — fact sheet for health professionals — NIH Office of Dietary Supplements
- Potassium — fact sheet for health professionals — NIH Office of Dietary Supplements
- Copper — fact sheet for health professionals — NIH Office of Dietary Supplements
Max Rubner-Institut (2025): Bundeslebensmittelschlüssel (BLS), Version 4.0 — Deutsche Nährstoffdatenbank. Karlsruhe. DOI: 10.25826/Data20251217-134202-0. Licence CC BY 4.0. Selenium and choline: U.S. Department of Agriculture, Agricultural Research Service. FoodData Central: SR Legacy, 2018. fdc.nal.usda.gov.